

Why we exist, is to reduce animal suffering by inspiring change at all levels. This sense of purpose drives every action in our unrelenting march forward for animals. — The Humane League
If you’re reading this post, you probably know a thing or two about data. You probably also care about giving back to your community. Grassroots organization Data for a Cause is helping people like you put their data skills to work to change the world.
Nonprofit organizations often don’t have the right resources to get the most from their data assets. That’s why Olga Tsubiks started the Data For a Cause Challenge: to help NGOs take advantage of the unexplored, useful data that they have, and find data through open sources.
We reached out to Olga to learn more about her motivation and vision for Data for a Cause’s most recent challenge supporting The Humane League’s 88% Campaign.
The cause behind the data
Farming underwent significant changes in the second half of the twentieth century. There was a widespread movement from small, family-owned farms to large, industrial-level production sites. Today many contain millions of animals confined to small cages in poor conditions. Such facilities are known as factory farms.
The cruel reality of these farms is kept far away from the public eye.

How many factories are out there? Where are the factory farms located? Are there factory farms in your state? We know very little about factory farms.
That’s where Data for a Cause and data.world come in. Data for a Cause, a group of 500 volunteers around the world, helps nonprofits tell their stories through data. They also use data.world for data discovery, sharing and cooperation.
Crafting the story
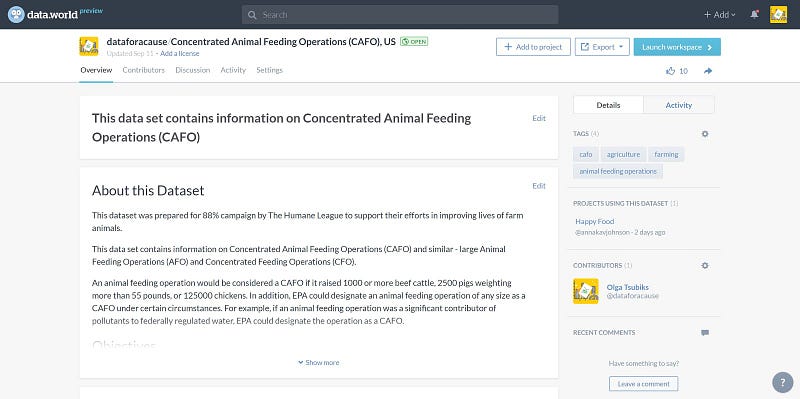
We did a quick search for “factory farm data” on data.world and came across data on Michigan factory farms.
It was a promising start, but we needed data for the entire country. And so, the painstaking data collection process began. We searched for data for each state individually, as well as by regions and nationally. Eventually, our research stopped yielding new results. We then published the final dataset on data.world.
Next, Data for a Cause volunteers dug into the dataset to create data visualizations that displayed factory farms across the United States. In total, seventeen data visualizations were created by volunteers from all over the world.
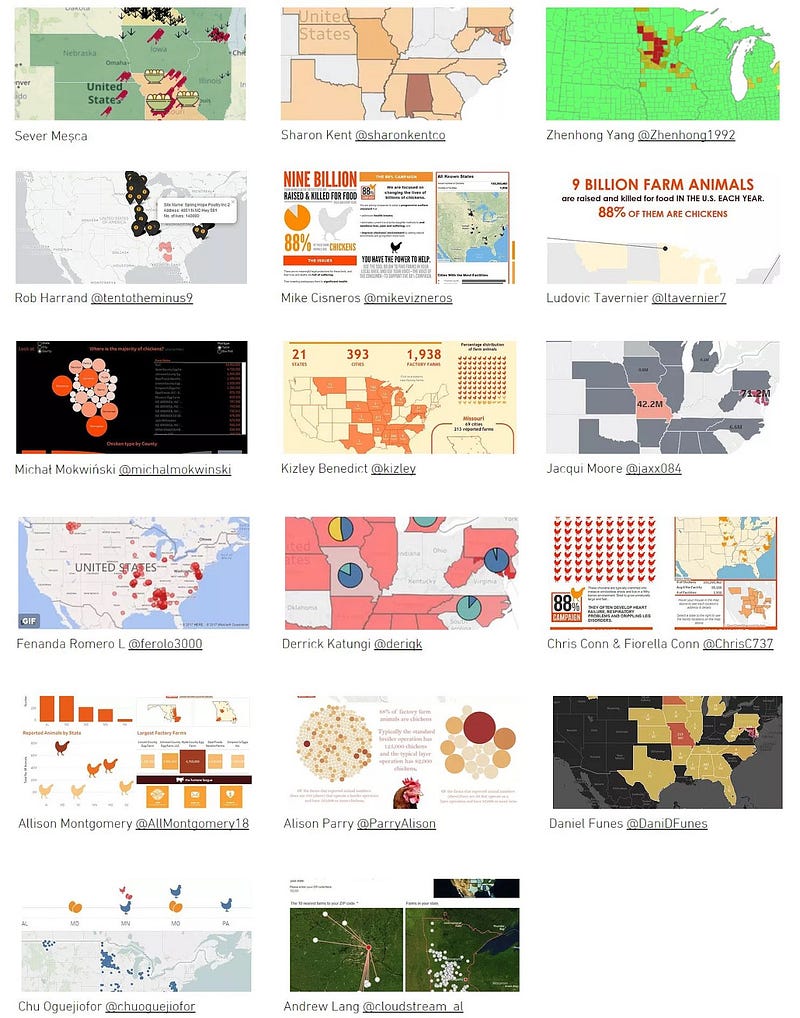
We passed our work on to The Humane League, a nonprofit organization that advocates for animal welfare and petitions companies to adopt progressive welfare standards. They will use our data visualizations to communicate the issue more effectively.
How you can help
A lot of the data about factory farms isn’t publicly available. We posted a message ‘into the future’ on data.world, in the hope that, as more data becomes public, other data.world members will add to the dataset.
The best part about this project is that it does not have an end. Anyone can use the dataset we created in their own projects.
Some people have already started doing so, creating apps to advocate healthier food from more humane farms.
This is just one of eight data visualization challenges we’ve done. Are you ready to put your skills to work for a good cause? Sign up to join the Data for a Cause Challenge to contribute to the next project.
If you’d like to learn how data.world can make your data teamwork easier, faster, and more collaborative, check out data.world for teams and request a demo.
